Introduction
- Supply and demand are fundamental concepts in microeconomics, serving as the bedrock for understanding how markets function.
- They represent the interaction between producers (supply) and consumers (demand) in a market economy.
The Law of Demand
- The Law of Demand states that, all else being equal, as the price of a good or service falls, the quantity demanded increases, and vice versa.
“The law of demand is a basic economic principle that states that the quantity demanded of a good or service is inversely related to its price, when other factors are held constant. This means that consumers will demand more of a good or service when its price is lower, and less when its price is higher. The law of demand is derived from the law of diminishing marginal utility and applies to various situations such as price determination and government policy formation.”
- Example: When the price of a toy car decreases, parents may buy more toy cars for their children.
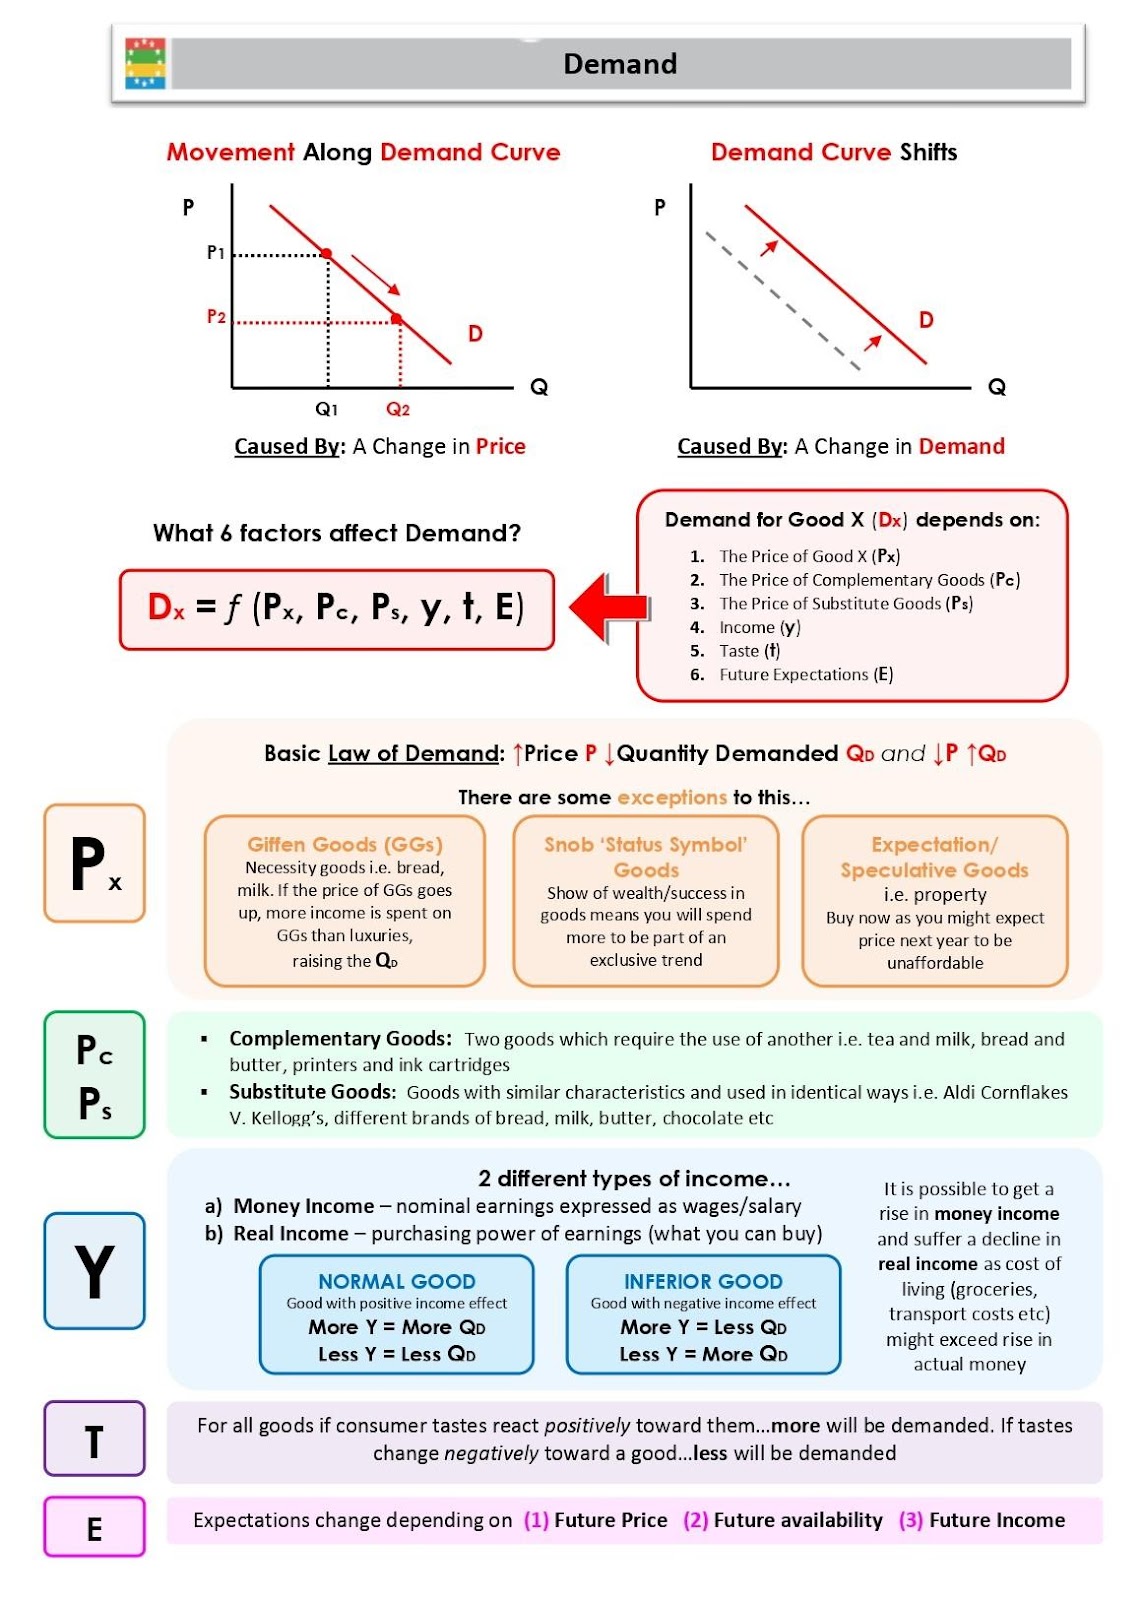
The Demand Curve
- A demand curve is a graphical representation of the relationship between the price of a product and the quantity demanded.
- It typically slopes downward from left to right.
- Example: McDonald’s may observe that as the price of Big Macs falls, the quantity of Big Macs sold increases, creating a demand curve.
Factors Affecting Demand
- Several factors influence demand, including:
- Income: As income rises, people may demand more luxury goods.
- Price of Related Goods: Substitutes and complements impact demand.
- Example: A rise in gas prices may increase the demand for electric cars.
- Consumer Preferences: Changing tastes can shift demand.
- Example: Health-conscious consumers may increase demand for organic produce.
The Law of Supply
- The Law of Supply states that, all else being equal, as the price of a good or service rises, the quantity supplied increases, and vice versa.
“The law of supply is a fundamental principle in economics that states that, all other factors being equal, as the price of a good or service increases, the quantity of that good or service that suppliers offer will increase, and vice versa. In simpler terms, this law means that as the price of an item goes up, suppliers will attempt to maximize their profits by increasing the number of that item they sell.
The law of supply can be summarized as follows:
A higher price will lead producers to supply a higher quantity to the market.
- When businesses expect to receive a higher price for something, they will produce more of it.
- Conversely, if prices fall, suppliers are disincentivized from producing as much.
Supply in a market can be depicted as an upward-sloping supply curve that shows how the quantity supplied will respond to various prices over a period of time.”
- Example: Car manufacturers may produce more vehicles when prices are high to maximize profits.
The Supply Curve
- A supply curve is a graphical representation of the relationship between the price of a product and the quantity supplied.
- It typically slopes upward from left to right.
- Example: A bakery may observe that as the price of bread rises, they supply more loaves, creating a supply curve.
Factors Affecting Supply
- Several factors influence supply, including:
- Production Costs: Higher costs can reduce supply.
- Example: If the price of wheat (a key ingredient for bread) increases, bakeries might supply fewer loaves.
- Technological Advancements: Improvements can increase supply.
- Example: Advances in smartphone manufacturing can lead to higher production.

- Example: Advances in smartphone manufacturing can lead to higher production.
- Government Policies: Regulations and taxes can impact supply.
- Example: Subsidies to farmers can increase the supply of agricultural products.
- Production Costs: Higher costs can reduce supply.

Market Equilibrium
- Market equilibrium occurs when the quantity demanded equals the quantity supplied at a specific price.
- At this point, there is no excess supply (surplus) or excess demand (shortage).
- Example: If the equilibrium price of apples is $1 per pound, the quantity supplied and quantity demanded will be equal at that price.
Price Changes and Equilibrium Shifts
- If the price is above the equilibrium, there’s a surplus, and prices tend to fall.
- If the price is below the equilibrium, there’s a shortage, and prices tend to rise.
- Example: During a sale, if the price of a popular gaming console drops below the equilibrium, there may be long lines and shortages in stores.
Elasticity of Demand and Supply
- Elasticity measures how responsive quantity demanded or supplied is to changes in price.
- If demand is elastic, a small price change leads to a large quantity change.
- If demand is inelastic, a large price change leads to a small quantity change.
- Example: Gasoline demand is often inelastic; even if prices soar, people still need to commute to work.
Cross-Price Elasticity
- Cross-price elasticity measures how the quantity demanded of one good responds to a change in the price of another.
- Positive cross-price elasticity indicates substitutes, while negative values suggest complements.
- Example: If the price of pizza rises, and the demand for pasta increases, it’s a positive cross-price elasticity.
Income Elasticity
- Income elasticity measures how demand changes with income.
- Normal goods have a positive income elasticity, while inferior goods have a negative one.
- Example: Video game consoles may have a high income elasticity, as people buy more when their incomes rise.
Government Interventions
- Governments can influence markets through taxes, subsidies, price controls, and regulations.
- Taxes on certain goods (e.g., cigarettes) can reduce demand.
- Subsidies for farmers can increase supply.
- Price ceilings (maximum prices) can create shortages, while price floors (minimum prices) can lead to surpluses.
Market Structures
- Different market structures (perfect competition, monopoly, oligopoly) impact supply and demand dynamics.
- In a perfectly competitive market, many small firms sell identical products, and prices are determined by supply and demand.
- Monopolies, on the other hand, have significant market power and can set prices.
- Oligopolies, with a few dominant firms, engage in strategic pricing.
Game Theory in Supply and Demand
- Game theory analyzes strategic interactions among competitors.
- In supply and demand, firms may engage in price wars or cooperate to maximize profits.
- Example: Airlines may use game theory to set ticket prices and compete effectively.
Conclusion
- Supply and demand are the cornerstones of microeconomics, guiding decision-making in markets.
- Understanding their dynamics, as well as elasticity, government interventions, and market structures, is vital for businesses, policymakers, and consumers.
- By grasping these concepts, individuals can make informed economic choices in a complex and interconnected world.